Creating One View Report Lists, Gauges, and Charts
Objective:
Demonstrate how to leverage lists, gauges, and charts in BI Publisher Layout Editor.
Duration:
35 minutes
Overview
BI Publisher Layout Editor provides several options to create graphical reports. The various components empower users to personalize reports that display JD Edwards EnterpriseOne data in a way that is intuitive and improves their day to day decisions.
In this exercise you will:
Create a new report.
Add and configure lists and gauges.
Work with chart properties.
Assumptions:
EnterpriseOne is installed and running.
BI Publisher Enterprise Edition 11g is installed and running.
Database has sample data available.
Create New Report
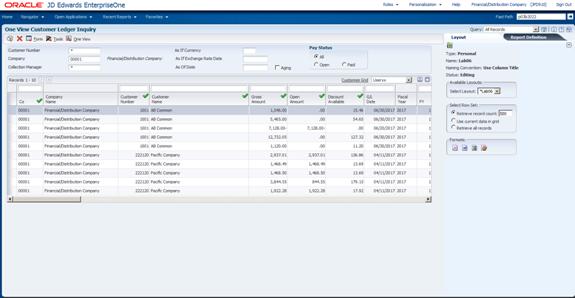
1. Open One View Customer Ledger Inquiry (P03B2022) from Fast Path or by navigating through the following menus: EnterpriseOne Menus, Financials, Accounts Receivable, Daily Processing, Accounts Receivable Inquiries.
2. To create a new report, from the ![]() , One View button select Add Reports.
, One View button select Add Reports.
- The right hand panel and Report Definition tab appears.
Note: You can access the One View button through Data Browser.
When creating a new report, besides selecting columns from the application to be added to the definition, you can Select Naming Convention for Data Model and Set Default Row Set to Run Report.
Select Naming Convention for Data Model:
This option determines the name of the fields that are displayed in BI Publisher Layout Editor.
Use Column Title:
This option will use the column description as they are displayed in the application. This option should be used for reports that will not be translated into multiple languages. It may be helpful to use Column titles because what the user sees in BIP will be exactly what they see in the interactive application.
Use Data Dictionary Item Name:
This option should be used if your report will be translated into other languages. This option will use the column titles from the data dictionary. So Company Name would appear in Layout Editor as Description. By using the Data Dictionary titles the fields in Layout Editor will be the same for all languages and allow the report to be share across languages.
3. Select Default Row Set to Run Report: Use the default value.
4. Any field from the grid can be added
to the Report Definition. To add a field, simply click on![]() associated
with the column. For this report, select the following columns:
associated
with the column. For this report, select the following columns:
- Customer Number
- Customer Name
- Gross Amount
- Open Amount
- CO
- Company Name
- Document Number
- Document Ty
- Document Type Description
- Pay Itm
- Discount Available
- A/R Cd9
- A/R Reporting Code 9
- A/R Reporting Code 10
5. To save the Report Definition click ![]() , and enter a report name.
, and enter a report name.
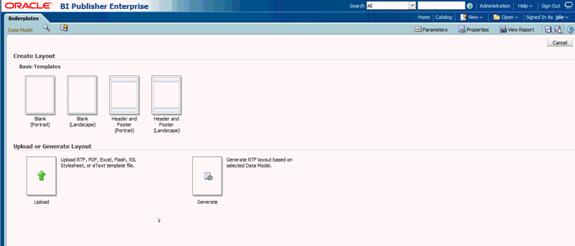
6. When BI Publisher opens, there are different options for layout. Select Header and Footer (Landscape).

Layout Editor opens with a blank page with a header and footer. Unlike creating a new report from a One View Application, there are no fields in the Data Source since there is no sample data.
7. To add a Grid Layout to the header, set focus on the header and select Layout Grid from the Insert Tab by dragging it into the header area.
This is a key component to creating a new report without a template because the Layout Grid creates regions on the report to insert other components such as Data Tables, Charts, Images, and other BIP components. The Layout Grid simplifies the process of aligning the various components and spacing.
You will be prompted to define the number of rows and columns for the grid.
8. For the Layout Grid in the header select 2 Rows and 3 Columns. Then click OK.
The Grid Layout will appear in the Header.
9. To resize the top row to be larger and the second row smaller, set focus in the middle cell in the top row and drag the blue line down.
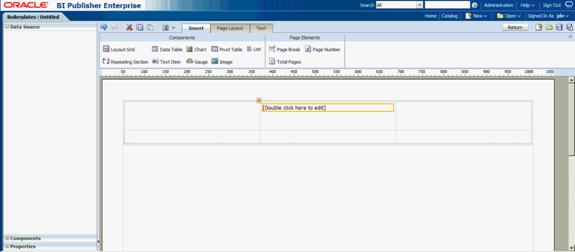
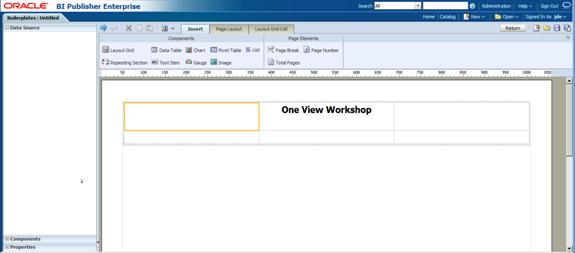
10. To insert a Report Title, drag Text Item into the middle cell of the top row.
![]()
![]()
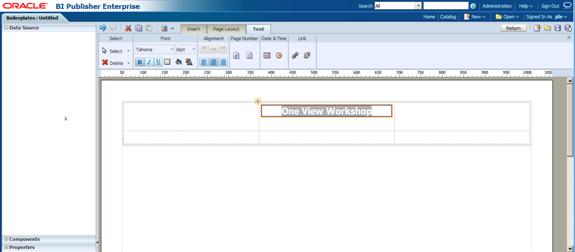
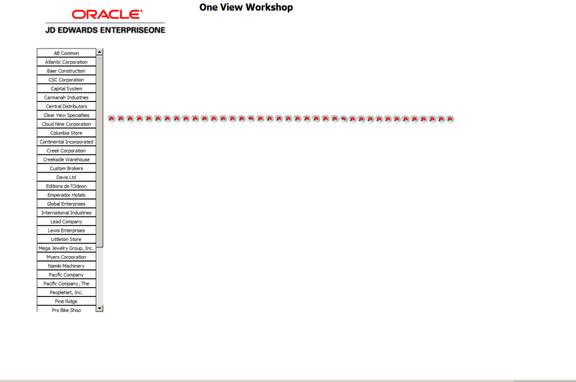
11. Double click on the Text Item to enter text and format the text. For the Report title type One View Workshop.
12. To format the text, change the font size to 16, Bold and center using the Text tab.
![]()
![]()
![]()
![]()
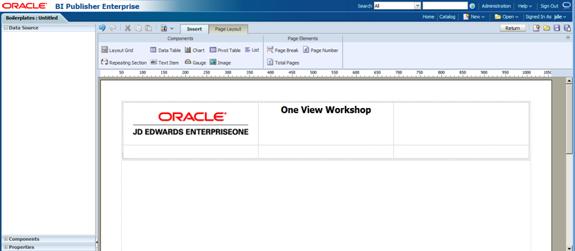
13. To add an image, set focus on the left cell on the top row.
14. From the Insert tab, drag and drop Image into the cell.
![]()
15. A dialog box will open to select the location of image. Click the Browse button and search for a logo or image that you would like to use.
16. Select an image to import and click Open, and then click Insert.
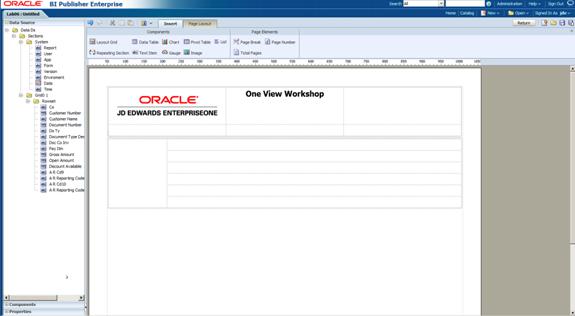
17. Set focus on the body of the page.

18. Drag Layout Grid into the body by page.
![]()
19. Enter 6 Rows and 2 Columns.
Add and Configure Lists and Gauges
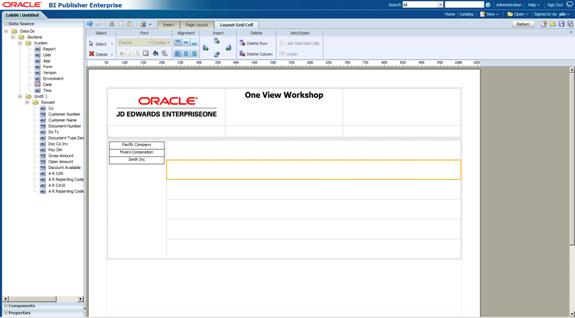
1. Select all the cells in the left column and Join Selected Cells.
![]()

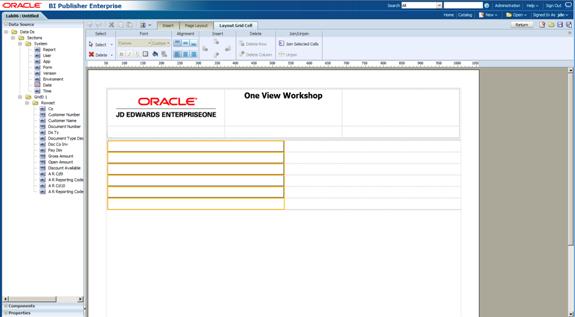
2. Resize the Layout Grid so that the left column is smaller than the right column.

3. Set the focus in the left column and insert a List component.
4. Next, assign a data field to the list. Drag Customer Name into the new list.
![]()
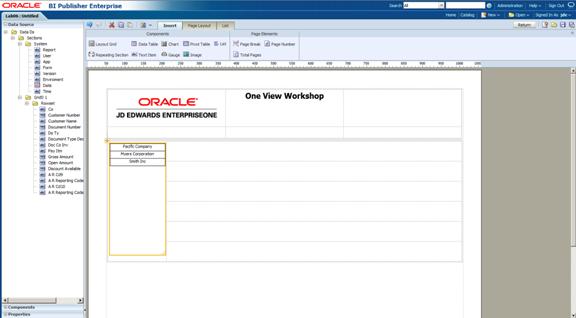
5. This will display the customer names down the left side of the report.
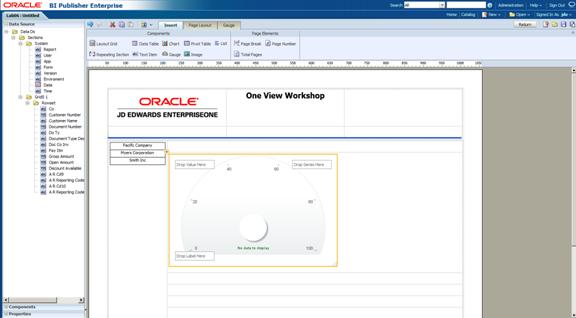
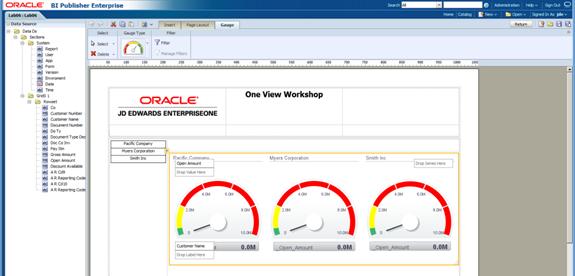
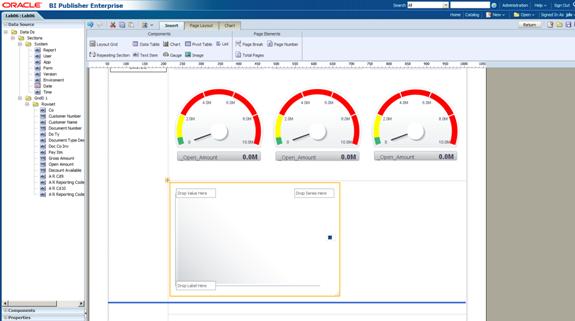
6. Set focus in the second row of the right column.
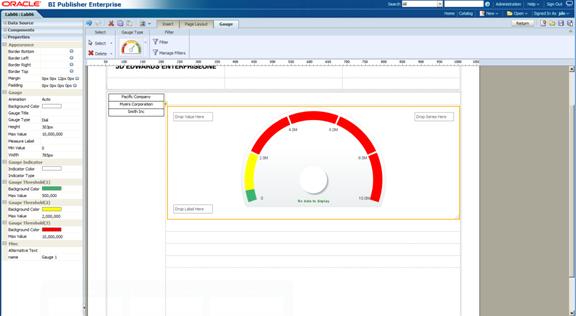
7. Add a Gauge to this cell.
![]()
8. To assign properties to the gauge, select Properties from the left hand panel.
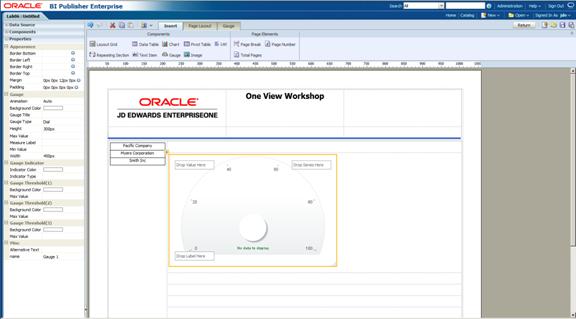
9. Assign values and colors for the gauge and thresholds as shown:
|
Gauge |
Threshold 1 |
Threshold 2 |
Threshold 3 |
|
Max Value:10,000,000 |
Max Value: 500,000 |
Max Value: 2,000,000 |
Max Value: 10,000,000 |
|
Min Value: 0 |
Background Color: Green |
Background Color: Yellow |
Background Color: Red |

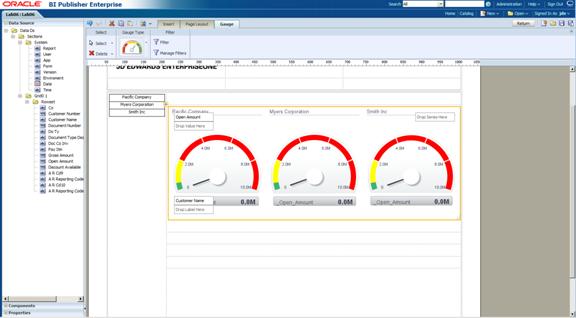
10. Resize the gauge to fit the cell.
11. Drag Customer Name to the lower label and Open Amount to the upper Value.
![]()
![]()
12. Save the report by clicking ![]() . Give the report the same name as the report definition.
. Give the report the same name as the report definition.
13. To close Layout Editor, close the window.
Note: Do not sign out. This will require you to sign out of EnterpriseOne and sign back in.
14. Go back to One View Customer Ledger Inquiry.
15. Change the query to All Records and enter 00001 in for Company
![]()
![]()
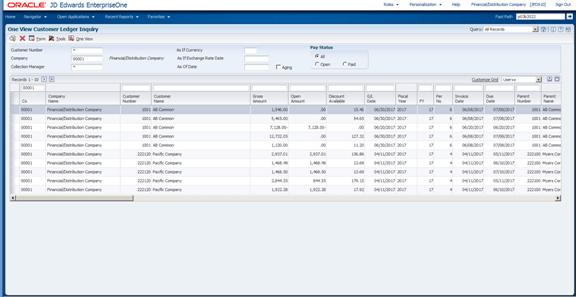
16. Click ![]() , the
new report appears. Select Report Name to run the report.
, the
new report appears. Select Report Name to run the report.
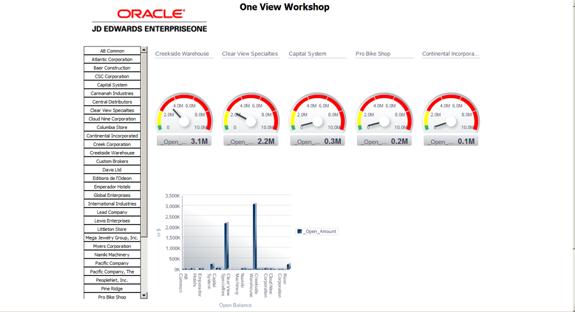
Notice that the list on the left is interactive and provides a quick view of customers. However, at this point, the gauges are not very useful. There are a couple of ways to resolve this issue. One is to use the Enhanced Query to select a smaller list of customers. Another option is to filter within the report. For this lab, the report will be modified to filter the data.
17. Close the report.
18. Click ![]() ,
Manage Reports, select your report, and
,
Manage Reports, select your report, and ![]() .
.
19. Within Layout Editor, select Edit.
![]()
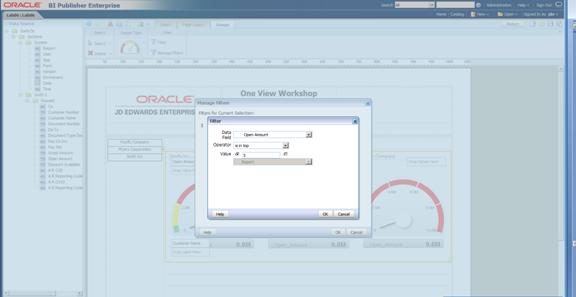
20. Set focus on the gauge and select Filter.
![]()
21. For the Data Field select Open Amount.
22. For Operator select Is In Top, and enter 5 for the Value.
23. Click OK.

24. Save the report by clicking ![]() .
.
25. To close Layout Editor, close the window.
Note: Do not sign out. This will require you to sign out of EnterpriseOne and sign back in.
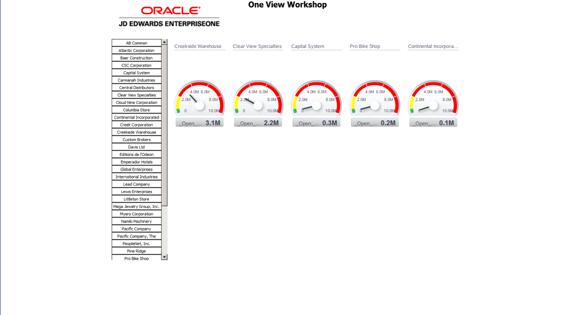
26. In the One View Customer Ledger
Inquiry, click ![]() , and select Report
Name to run the report.
, and select Report
Name to run the report.
27. Notice that the gauges are limited to only five.
Working with Chart Properties
1. Click ![]() , Manage Reports, select your report,
and
, Manage Reports, select your report,
and ![]() .
.
![]()
2. Within Layout Editor, select Edit.
3. Set focus in the third row in the Layout Grid.
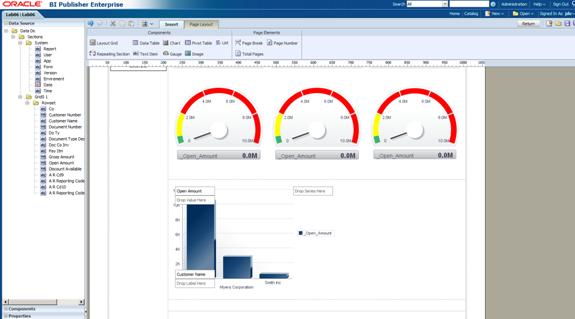
4. Insert a Chart.
![]()
5. Drag Open Amount to the Y axis and Customer Name to X axis.
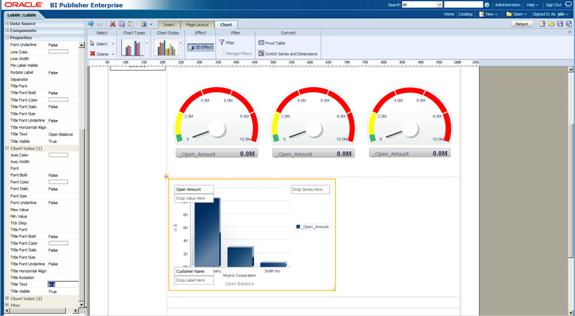
6. Select Properties for the Chart.
7. Click on Chart Label and enter Open Amounts in Title Text.
![]()
![]()
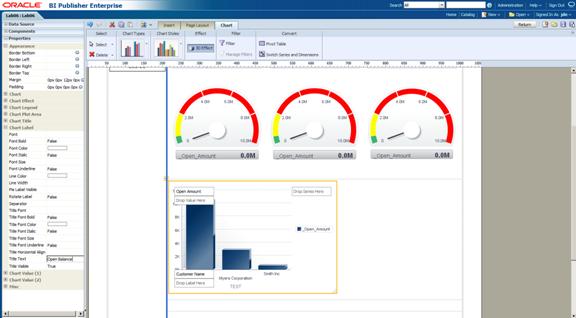
8. Select Chart Value (1) and Title Text enter in $.
![]()
![]()
9. Open and review the other options for the chart that can be changed.
10. Save the report by clicking ![]() .
.
11. To close Layout Editor, close the window.
Note: Do not sign out. This will require you to sign out of EnterpriseOne and sign back in.
12. Go back to One View Customer Ledger Inquiry.
13. Click ![]() , and
select report name to run the report.
, and
select report name to run the report.